2020 AnimState of the Industry Results

Thank you to everyone that took the time to fill out our survey! We had a fantastic turnout of over 400 responses. Similar surveys by Gamasutra or IGDA averaged around 1200 responses across all disciplines, so collecting a third of that for an entirely animation-focused survey is a solid representation of the animation community within the industry.
I am going to cover a number of the interesting results from the survey in this post, so buckle in because this is a long one. If you’re interested in the raw, unfiltered results, we’re making that available to you here in this google sheet so you can read through and cross reference to your heart’s content! It comes available with all of my working tabs as reference, so just make a copy or export it to an excel doc and give into your data loving self!
A giant thank you to Ju Li for helping me wordsmith this into something able to be read. I was a robot spitting numbers before she did a pass, so please give her a virtual high five for keeping your eyes from instantly glazing over.
Also a disclaimer: I am not a professional or trained data analyst. I am sure there are percentages of error and likely biases in the way we asked some questions or in the format as a whole. This is something I hope to correct in future surveys. Please do not hesitate to call out anything you see along those lines that you believe should be addressed.
If you have questions or thoughts about any of these findings or ways to help us make future surveys better, please log on to the AnimState discord and go to the #annual_survey channel to post your thoughts, findings and questions.
With all that said, let’s move on to the data and break everything down by the different sections of the survey! First up is Work Experience.
Work Experience
To get a snapshot of who was taking our survey, we asked questions about positions, studios, time in the industry and geological spread.
Of the people who took our survey, 67% are Animators, 23% Technical Animators and 8% Animation Programmers. There were also 18% who identified as Leads/Director with some crossover identifying as both Animator/Tech Animator or Lead/Director and discipline.
The majority of our respondents are Full-Time Permanent (83%). Of the remainder, 10% are Full-Time (Temporary/Contract) and 7% Freelance.
For years in the industry, there was a pretty clear spread across the board, with the majority of people falling into the range of 1-15 years experience.

For type of game studio, we had 67% working in AAA, 28% Indie and 5% working across Mobile, Online, VR/AR or other fields with interactive animation.
The majority of people who took our survey came from North America (61%) and Europe (34%) with the remaining 5% coming from Asia and South America.
So before continuing on, it’s good to note the majority of our respondents are Full-Time Animators living in North America working in AAA. If there are any specific data points you are interested in especially in regards to your own experience, please feel free to cross check using the results sheet I’ve provided above.
With all of that in mind, let’s next look at Tech and Tools!
Tech and Tools
When it comes to animating in the industry, a lot of animators are split between implementing things in engine and creating animations/tools. Before getting into this section, it’s important to note we’re using DCC (Digital Content Creation) as a catch all term for work done outside of the engine.
As to what software DCC covers, Autodesk is still the go to software with most people using Maya (86%), Motionbuilder (39%) and 3Ds Max (18%) with open-source program Blender (9%) coming in a distant fourth place. The remaining 3% are various softwares, like Cascadeur, Akeytsu, and Modo.
For rigs, 53% are Custom Built, 27% Automated/Scripted and 14% are Out of the Box (e.g. HIK, CAT or Biped). The remaining 6% are a mix of options.
For engines being used, we have 41% Unreal. 37% Proprietary engines and 14% Unity. The other 8% use a mix of 3rd party options.
For balance of time spent in engine vs DCC, 47% spend eighty percent of time in DCC, 32% spend half their time in DCC and half in engine, 10% spend all their time in DCC with no in engine work, and the remaining 11% spend most/all of their time in engine.

Breaking down numbers a bit more to see if there’s a difference in time spent in engine for Unreal vs Proprietary, we see there isn’t significant difference between the two, but there are some slight indications of specialized proprietary knowledge pushing more people to the extremes & Unreal’s well documented workflows allowing for a “dabble in engine” approach.
Now we come to the question that kicked off the entire survey! Who is responsible for the implementation of animation?
For this question, we’ve broken down Implementation into three categories: Basic (e.g. exporting, adding to lists/sets, blend times and tagging),
Intermediate (e.g. updating/adding to existing state graphs, blend spaces, additives and layers),
Adavanced (e.g. state graph architecture, visual scripting, procedural systems, ik and ragdolls).
For Basic, it breaks down to 74% animators, 15% tech animators, 6% designers, and 4% programmers.
For Intermediate, it was 55% animators. 28% tech animators. 10% programmers, and 7% designers.
And when it came to Advanced, the percentages are 45% programmers, 38% tech animators, 11% animators, and 6% designers.
So overall, our results show that animators are doing the bulk of implementation up until the needs are more advanced at which point programmers and technical animators take over responsibility with a consistent 6% of designers involved in all levels of implementation.
This breakdown of responsibility was something I also wanted to check for Unreal vs Proprietary engines.
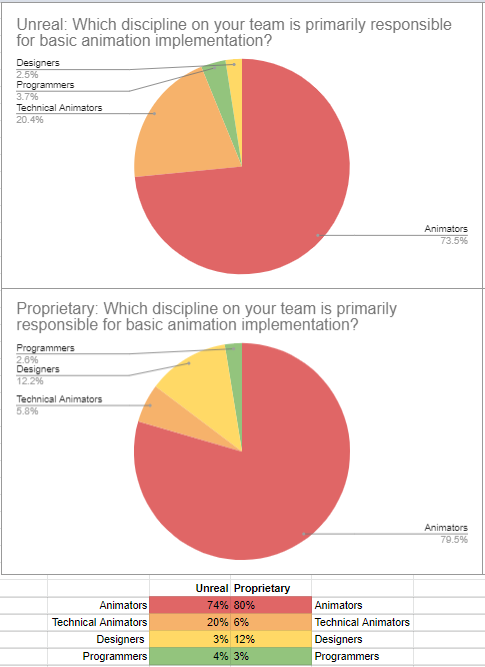
Basic Implementation

Intermediate Implementation
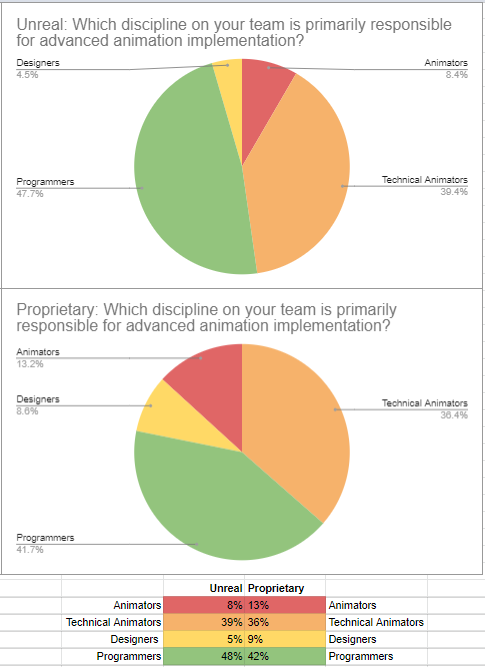
Advanced Implementation
Surprisingly, animators and designers seem to have MORE responsibility in regards to implementation in Proprietary engines over Unreal.
Following up on all of that, we asked respondents to rate how they felt about the statement “animators should be responsible for doing as much implementation as possible” from a scale of 1 (Very Much Agree) to 5 (Very Much Disagree).

As the chart shows, the majority felt animators should have significant to major responsibility in regards to implementation.
One of the factors in that is how user friendly it is to use the implementation tools. In response to that question, we had mixed to slightly positive impressions. In the following chart, 1 means Very User Friendly and 5 means Not User Friendly At All.

Once again, I wanted to check this between Unreal and Proprietary Engines, because animators seemed to have more responsibility in proprietary workflows.

Even though animators are spending MORE time working in proprietary engines, they are reporting those engines to be less user friendly than Unreal. While there is likely a correlation to more users meaning more dissatisfied users hitting against the edges of a tool, the numbers are significant enough to assume factors like easy access to tutorials make it more user friendly than Proprietary engines.
The last bit of tech responses to cover are Machine Learning and Motion Matching. These topics come up a lot when we talk about the future of game animation, so it’s good to get a picture of what everyone’s experience with them looks like.
It turns out still a bit in the future, because out of the respondents 77% are not using motion matching and 87% are not using machine learning.
Since Unreal is the primary engine being used in studios and it doesn’t support either motion matching or machine learning out of the box, I broke it down by Unreal vs. Proprietary again since using these methods require dedicated programming support regardless.
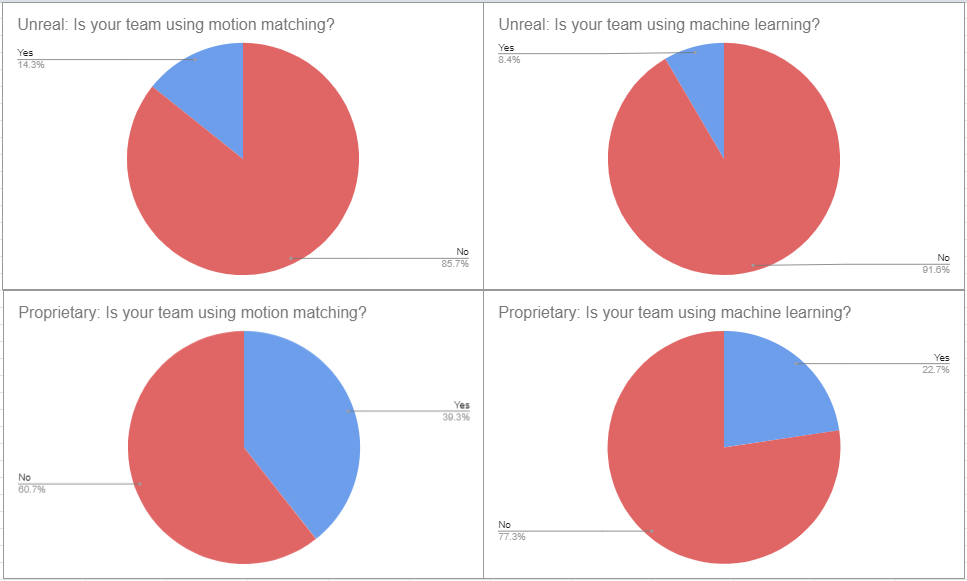
It would be pure speculation on my part as to why these numbers show more than double the adoption rate of these technologies when using proprietary engines, but it was an interesting point of data to find.
The next stop on our survey tour is Team Size!
Team Size
Most segments of team sizes from 6 people up to 400 had an average response base between 5%-8%, but the three biggest contributors were team sizes of 400+ at 18%, 200-300 at 15%, and 100-150 at 10%. I greatly encourage you to do cross referencing on team sizes for more specific results, but since it was a fairly even spread across the board, I will only present the general results here.
First up is the number of gameplay animators on the team with the two largest segments being 2-4 (32%) and 5-10 (27.9%).

The results for dedicated cinematic animators on a team was a bit surprising at first glance. For almost 37% of teams, there is no dedicated cinematic animator on the team. Remember that number when we get to outsourcing!

Breaking down the make up of technical animator teams, when it comes to DCC focused technical animators, 39% had 2-4, 29% have only 1, and 24% have 0.

Those numbers are mirrored when looking at how many runtime focused technical animators there are on a team. 38% have 0, 29% have 1 and 28% have 2-4.

We also asked how many teams had animation programming support. For over 50% of teams, there is no dedicated animation programmers.

Most teams have their programmers splitting their time between animation and other departments.

This was another data point I wanted to compare Unreal vs Proprietary engines to see if numbers differed. Proprietary engines did in fact have more dedicated animation programmers with 2-4 making up the largest percentage at 38%.

When comparing shared programmers by engine, the numbers vary slightly there as well with more shared programming support also happening on the proprietary side.

In general, it seems proprietary engines result in more animation programming support overall.
Okay, so let’s look next at how teams use different types of Motion Capture!
Capture
For over a decade now, it’s been a common fear that motion capture animation is taking over for keyframe. That sentiment pops up later in the the concerns people have listed. However, this graph is an interesting data point in that conversation. This graph goes from 1 (100% keyframe) to 5 (100% mocap).

As you can see 37% of teams make all of their new animations through keyframe, the largest percentage of the group. Of course, another way to read this graph is 63% of teams use motion capture of some kind, but only 6% use motion capture entirely without any keyframe. It appears the concern of mocap killing keyframe is greatly exaggerated. With the high turn around in games it is certainly a regularly used tool, but it exists alongside keyframe, not as a replacement.
Looking at how people are capturing their data, 48% use Optical Motion Capture, 33% use Inertial, and 31% use Performance Capture.
As far as where the capture stage is located, 64% of teams capture in studio, 20% travel out of town to work with an external partner and 19% capture Fully Remotely. It will be interesting to see how these numbers are affected by the uptick in remote work after Covid.
It is now time to check in on our External Development results!
External Development
Outsourcing is another common factor in conversations about how game animation can be done more efficiently. Often times it is brought up by production partners or studio leadership as a novel solution to unlock more development possibilities.
The majority of teams, 74%, work with external partners/outsourcing. Let’s look at how people are engaging with external development.

49% of teams rely on their lead or director to be the primary point of contact for external partners. 25% have dedicated outsource managers or directors doing that work. The last 22% of teams share that responsibility across all of the animators. It is great seeing a rise in dedicated OS managers/directors as that is one of the best way to support the process and make the most of both your internal and external team members.
The biggest type of animation work being done by external partners is cinematic animation at 59%. Looking back at the section on team breakdown with 40% of teams not having cinematic animators on staff, it looks like there is a correlation.
The other type of animation work most often sent to outsourcing is Vanity Animations (e.g. emotes, dances) at 45%, followed by Player Gameplay Animations (32%), AI Gameplay Animations (26%), and Rigging/Skinning (28%).
When it comes to which aspects of implementation external partners are responsible for, 77% check their work into source control and 56% export the animation from the DCC. From there, 22% add exported animations to animation lists/sets and then 16% are responsible for tagging the animations. Beyond that, 14% handle intermediate complexity tasks and 7% take on the advanced complexity tasks.
As for the number of external animators and technical animators teams are working with, here are the results.


There would be some definite value in cross checking the type of work being sent out against who is responsible for directly communicating with external partners.
This seems like the perfect time to look at the results around Leadership and Direction!
Leadership and Direction
When it comes to animation team leadership, 84% have a Lead Animator, 43% have an Animation Director, 32% have a Lead Technical Animator, 14% have a Lead Animation Programmer, 12% have a Technical Animation Director, and 2% have an Animation Programming Director.
Looking at who is responsible for team member’s career growths (e.g. 1:1s, performance reviews and career management) it is their Lead in 55% of cases, for 36% it was either their Director or Studio Manager/HR.
Digging into those numbers a bit more, the next two questions were around how often team members interface directly with their Lead, the chart going from 1 (Daily) to 5 (Weekly).


As you can see, most team members interact with their Lead once a day, but only interact with their director once a week.
Our next question was about who is responsible for an animation team’s schedules and scope. 1 means it is 100% the responsibility of the Lead/Director and 5 means it is 100% the responsibility of the Production Partner.

The numbers were fairly spread out across the board with a 50/50 split of responsibility being the highest percentage at 32%. 43% of respondents stated the majority of that responsibility fell to Lead/Director and 26% stated the majority fell to Production.
Since Individual Contributors (Animators, Technical Animators, Programmers) may get their tasks from their Leads/Directors, but behind the scenes Production Partners are more involved, I decided to cross check these results against each other. When breaking these apart, there was indeed a difference.

Leads/Directors report higher levels of responsibility in terms of scoping and scheduling than Individual Contributors. Now before we throw Production Partners under the bus, what this tells me is that we have a need to better train them in regards to animation. There is certainly a trust and proficiency gap happening here that would be in the benefit of everyone to solve. This will become more of an necessary discussion as we get into the follow up questions about the reported studio and industry struggles.
Digging into a Lead and Director responsibilities more, we separated the roles for the next two questions.
A common idea when it comes to leading a team is that 50% of the time is spent creating work and 50% of the time is spent supervising other people’s creations. However the majority of leads (38%) report that they typically spend 75% of their time supervising. Only 24% responded with a 50/50 split and 13% said they spend all their time creating their own work. For clarity, here is the graph.

Next we asked how much of the Lead’s time is spent driving the creative vision vs driving production. Though weighted slightly more towards meeting production deadlines, it was pretty spread across the board with most saying it as a 50/50 split.

When asking those same two questions of Directors, Directors have a more varied set of responses in regards to hands on creating vs supervising others creations.

And when it came to driving creative vision vs production, it was again pretty spread across the board with the majority saying it was a 50/50 split, but this time the numbers was weighted slightly more towards creative vision.

It would be certainly be interesting to cross check Directors with Leads on their teams vs Directors without Leads to see if having Leads is enabling Directors to have more flexibility in their responsibilities.
It is time to see how all of this adds up with our general Miscellaneous results.
Miscellaneous
The last section of the survey was about how people feel about their studio and industry in regards to animation, training, and career growth.
For questions that were open ended responses, I tried to categorize them around consistent themes that emerged. Across all the questions around what we are struggling with, this resulted in:
Production (Scope, Team Size, Scheduling, Communication Issues, etc)
Tech (Outdated Tools and Tech, Tech Constraints, etc)
Creative (Quality Concerns, Game Feel, New Ideas, Lack of Keyframe)
Leadership (A subset of Production, but called out often enough)
Hiring (Unable to find the needed talent or skillset)
Knowledge Sharing (Training, Cross Studio/Industry Communication)
Diversity
Pay
Capture
Outsource
Our first question was to ask people what their studio most struggles with in regards to animation.

As a continued thread from the Leadership section, we can see Production issues are the primary concern of respondents, followed by Tech, Leadership, and then Creative.
When we asked people what the industry most struggles with in regards to animation, we got slightly different results.

Production was again was the biggest concern followed by Tech though not to the same degree as their own studio. We also see Creative concerns jump up noticeably, and the addition of Diversity concerns. By the numbers, it appears people think far less of their own studio’s tech compared to the rest of the industry and think far higher of their own studio’s creativity compared to the rest of the industry. More open, honest and regular knowledge sharing could certainly help to align those more. In regards to Diversity, we will be digging into that in just a moment.
Following up on how people view their studio vs the rest of the industry, this is the graph for how much people believe their studio values animation (1 means A Lot and 5 means Not At All).

In general, people are pretty positive in how they feel their studio values animation. But when we compare that to how people believe the industry values animation…

While still more positive than negative, it isn’t as heavily weighted to the positive side of the graph.
When it comes to studios providing the necessary training needed to do their job well, the response was pretty positive. In this graph, 1 means they were Very Well Provided and 5 is they were Not Provided At All.

When asked if the studio provided them a clear path for career growth, the responses were a more evenly split, but still more positive than I would have suspected.

The next three questions were again open ended and were broken down into the following categories.
Tech (General catch all for non specific tools or tech, separate from the following)
Motion Matching
Machine Learning (Automation was also brought under this umbrella)
Procedural
Workflows (This includes implementation)
DCC (Rigging, Tech Anim, specific software)
Capture (Motion, Performance and Facial Capture)
Creative (New ideas, style, quality, keyframe)
Production (Communication, scope, budgets, etc)
Culture (Diversity, Inclusion, Equality, Exploitation)
Fundamentals (Could be a subset of workflows, but called out enough to warrant it’s own category)
Outsource
Knowledge Sharing
When asked what areas or topics around game animation people want to learn about, the most common response was Workflows at 29%.

Creative, Tech, Motion Matching, and Machine Learning were also high on people’s lists of areas they want to learn more about. These will be recurring trends as you are about to see.

When asked what they were most worried about in regards to the future of game animation, the most common response was Production at 29%. As we have seen throughout this survey, this is something we as an industry need to spend more time discussing and trying to solve. However, only 4% want to learn about it, so I suspect some less than enthusiastic conversations are going to have to happen!
Following Production in what people worry about the most, Creative stagnation and conformity was a big one, followed by Machine Learning. Luckily, both of those are areas people are excited to learn about and engage with, so it will be exciting to see how these sentiments change and grow over the coming years.
The final question was what has you the most excited about the future of game animation. The most common response was Creative at 27%, followed closely by Tech at 25%.

This is where we see the optimism that comes with people willing to engage with something that worries them. Specifically in terms of Machine Learning and Motion Matching, people were responding that they are excited to learn more about how these new advancements in tech can help enable us to be more creative as a whole. I can’t think of a better sentiment than that when tackling the future of interactive animation!
All of this has been through the lens of the majority of respondents, so we need to now look at the results through the lens of Diversity.
Diversity
I wanted to wrap up this post by taking a closer look at the responses around Diversity, specifically from the women who took our survey. But before we do that, let’s look at a high level view to explain why that’s important.
75% of the people who took our survey are White. As a note, the survey listed this option as Caucasian, but that is an outdated term from a racist form of identifying ethnicity, so I apologize for its usage and assure you we will not be using it in the future. Thank you to the person in the survey that called that out in their response.
The percentage of the other ethnicities of our respondants are 10% Latino/Hispanic, 9% East Asian, 3% South Asian, 3% Middle Eastern, and 2% African.
For gender, 82% are Men, 17% are Women and 3% are either Non-Binary, Questioning, Trans, and/or Closeted/Not Out. For everyone who answered Questioning or Closeted/Not Out, I want to thank you for trusting the anonymity of our survey to convey this information. I appreciate how sensitive that information is to you and I assure you the importance of this being an anonymous survey will continue to be at the core of how it is run in the future.
For age range, 26% are 26-30 years old, 22% are 31-35, 21% are 36-40, 13% are 21-25, 12% are 41-45 and 5% were 46-50. The remaining percentage is split rather evenly across the other age groups.
In terms of relationship status, 48% are Married or in a Domestic Partnership, 28% are in a Relationship and 24% are Single.
In terms of parenting, 70% of respondents are not parents. Of the 30% of parents that responded, when asked their role as a childcare provider on top of work, 48% are Sharing with a Partner or Family Member. 26% are Co-Parenting, 10% have an External Provider (e.g. daycare/Nanny/School) and 8% are the Primary Caregiver.
So when wanting to do a deep dive on how we can become a more inclusive animation community, I chose to look at specifically women’s answers compared to men’s for a couple of reasons. The first is that of these different representations, the percentage of women were the highest of any other single group, giving us the strongest base to check against. Also, our animation community has worked hard to be more inclusive to women and we have women running most of our initiatives and activities. The focus here on women is not meant to be a substitute or catch all for creating true inclusivity. This data does not speak for the totality of women or address the reality of intersectionality. But the hope is to find places within the data that we can start focusing on to help create a more diverse and inclusive community.
Women and Men
Let’s look first at the percentage of women at different years of experience within the industry. The average of all experience levels is 17%. When breaking those down, 27% have 1-5 years industry experience. The next 21% have less than 1 year experience. 14% have 6-10 years, 5% have 11-15 years and 11% have 16-20 years. No women responding to the survey had over 20 years experience. This will be something we want to track closely over the coming years, as there are two factors we are keenly aware of that will influence this. The first is that recent industry and community efforts have been focused on being more inclusive, which is potentially proven out by a larger percentage of more recent entries to the industry. But the other factor is that often people burn out after 5 years in the industry, with this more often affecting women than men, as this data could also prove out. Seeing how this trends over a few years will show if we have built an industry that not only reaches out to women, but supports them once they join. Because all of this will be necessary to push towards a more representative percentage of gender.
When looking at the percentage of women in the different parts of the game industry, be it AAA, Indie, or Other (Mobile, VR/AR, etc) the percentage was functionally the same. So any impressions people might have there were not proven out.
Next I wanted to look at Career Growth and Job Training, to see how those track.
When asked if their studio provides a clear path towards career growth:

The two points of any significant difference here are Some and Not At All. Men seem to be a bit more lukewarm around clear career growth, where as women are a bit more fully negative on clear career growth. This shouldn’t be too much of a shock to anyone, and honestly, these numbers were more closely aligned than I was expecting.
When asked if their studio provides the necessary training you need to do your job well:

Women tend to be more positive around the training opportunities provided towards them. Which I would have expected to have a more direct correlation towards clarity of career growth. But that is not proven out in the data. More than training is required in providing a clear path towards career growth.
So then looking at the struggles women are facing within their studios was the next step.

There are a few noticeable differences here. Women called out Creative issues as something their studio struggles less than Men did. They also did not call out Pay, Hiring or Capture. In the case of struggles, Capture was often associated with being a method that takes away from Creativity, so those two areas are linked. Women did however call out Outsourcing as a struggle, which Men didn’t. This often meant the struggle was around not doing it well or it being a concern of job loss. Women also called out Tech struggles at a significantly higher percentage than Men.
I am going to be making some inferences here, based on all of the data we have seen. Pay and Hiring are often vocal concerns of more senior or lead members of the team. Likewise, the concern of outsourcing taking a job often aligns with the skill set of less experienced team members, whose primary tasks include those most easily outsourced. So it will be interesting to see if, as the percentage of women increase at higher levels of experience, if those numbers line up. But the disparity in the Creative and Tech percentages are larger and not so easily explained by the data. Let’s pull back to a higher vantage point.
When asked what the industry is most struggling with in regards to animation:

Here we see Tech is again a significant difference, but this time it is the inverse, with Men reporting it a bigger struggle than Women. In every other aspect, there is not a significant difference. So let’s talk Tech and Creative, as far as the impressions by Women and Men.
What we know that from other questions around studio vs industry impressions, people tend to think more positively of their own studio than the industry as a whole in terms of creativity and support of animation. It is easy to infer that this comes from being more engaged on a daily level in terms of development, seeing the effort, attention and care being paid to what is being made.
So in terms of Tech, for Women to respond that their studio struggles more than the industry, following the above line of reasoning, they may not be as involved in the discussions around the tech. Then, when looking to the entire industry, Women are less worried about tech than Men. Because industry wide tech discussions often tend to glamorize and showcase the best of what tech can offer, it is easy to see that as less of a struggle, because it looks like the industry is well on track in terms of technical capabilities. I will admit, that is a lot of inference and conjecture to try and prove the data. But based on women historically being pushed away from STEM, it certainly seems plausible and worth all of us examining within our own organizations.
When we then look at why women cite Creative struggles within their studio less often then men, it could very well be that if women are not being part of the Tech conversations, their focus is more naturally focused on the Creative conversations. In which case, based on studio bias, it could explain why those numbers even out on the industry level. Let’s look at what excites people to see if that can give us any additional insight.
When asked what has them the most excited about the future of game animation, these were our responses:

More than 55% of responses for Women were around excitement about the Creative possibilities of interactive animation! That is the largest difference in any data point we have seen. Clearly, women’s responses were focused on the creativity space of games in a way men’s were not. To say anything more than that would be reductive or subjective in a way that doesn’t help anyone. But clearly things are not the same across the responses from women and men. And while there are clearly large scale production issues we need to address, it is unlikely they will equally lift up and empower men and women equally.
What I will say is that if you are a lead, director, manager or conference/community organizer, it would be valuable to look through the lens of this data to see how it applies to your organization. And more than anything, if we want to create a truly representative industry, it is our responsibility to actively reach out, empower and support your team members. Regularly have 1:1 sessions and listen to what struggles they are having and what areas of interest they would like to learn more about. Because all of this data doesn’t replace face to face conversations in building the trust needed to create a fully inclusive and representative industry.
Wrap Up
There are so many more data points that could be cross checked here across discipline, experience, team size, ethnicity, age, dcc, outsourcing… the possibilities are enormous. And we have only scratched the surface.
We know we want this to be an annual survey. And we know we missed some crucial questions around salary and job satisfaction that would help shine an even brighter light on what we have. Honestly, this feels more like the beta version than the full release. And I am sure once everyone has read this over and looked through the data, there are going to be a number of great conversations around other areas we want to explore.
SO, we will be running this again in February with the necessary updates, additions, and adjustments. And the hope is that we can have all of the results processed then in time for end of fiscal year conversations. Because the clearer picture we all have, the stronger we all are as a community. AnimState is about democratization of knowledge and open communication. So please, get involved on the AnimState discord and post your thoughts, findings and questions in the #annual_survey channel to keep this conversation going.